Contact us
  • en
  • fr
  • Solutions
    • Company IntranetDiscover our company intranet software to connect and engage your employees
    • Collaboration PlatformDiscover our digital collaboration platform that boost your employee engagement and performance
    • Knowledge ManagementHow To build and manage your knowledge base with eXo Platform
    • Employee EngagementDiscover how to boost your employee engagement
  • Product
    • Overview
      • Software TourAn overview of our software capabilities
      • Why eXoHow eXo improves your employee experience
    • Features
      • CommunicationFeatures to facilitate employee communications
      • CollaborationFeatures to create efficient teams
      • KnowledgeKnowledge management capabilities
      • ProductivityEmployee productivity tools to engage employees
    • Technology
      • Open sourceAn overview of our technology
      • IntegrationsDiscover how eXo integrates with your tools and systems
      • SecurityHow eXo Platform ensures your data security
  • Pricing
    • Product pricingLearn about our business model and pricing
    • ServicesLearn about our professional services
    • FAQsQuestions about the software, the community and our offers
  • Resources
    • Resource center
      • Case studies
      • White Papers
      • Datasheets
      • Videos
    • Technical documentation
      • Getting started
      • Developer Guide
      • Technical administration guide
      • REST APIs
    • From The Blog
      • eXo Platform 6.4 is here, available in both Enterprise and Community editions!
      • eXo Platform community edition is back
      • Cloud Vs On-premise Digital Workplace: Which one is right for your business?
  • Company
    • About us
    • Careers
    • Customers
    • Newsroom
    • Contact us
    • Partners
  • Menu mobile
    • Pricing
    • About us
    • Services
    • FAQs
    • Customers
    • Resource center
    • Contact us
    • Blog
Company Intranet Discover our company intranet software to connect and engage your employees
Collaboration Platform Discover our digital collaboration platform that boost your employee engagement and performance
Knowledge Management How To build and manage your knowledge base with eXo Platform
Employee Engagement Discover how to boost your employee engagement
Overview
  • Software Tour An overview of our software capabilities
  • Why eXo How eXo improves your employee experience
Features
  • Communication Features to facilitate employee communications
  • Collaboration Features to create efficient teams
  • Knowledge Knowledge management capabilities
  • Productivity Employee productivity tools to engage employees
Technology
  • Open source An overview of our technology
  • Integrations Discover how eXo integrates with your tools and systems
  • Security How eXo Platform ensures your data security
Product pricing Learn about our business model and pricing
Services Learn about our professional services
FAQs Questions about the software, the community and our offers
Resource center
  • Case studies
  • White Papers
  • Datasheets
  • Videos
Technical documentation
  • Getting started
  • Developer Guide
  • Technical administration guide
  • REST APIs
From The Blog
  • eXo Platform 6.4 is here, available in both Enterprise and Community editions!
  • eXo Platform community edition is back
  • Cloud Vs On-premise Digital Workplace: Which one is right for your business?
About us
Careers
Customers
Newsroom
Contact us
Partners
Pricing
About us
Services
FAQs
Customers
Resource center
Contact us
Blog
  1. Accueil
  2. Uncategorized
  3. Building a Marketing Dashboard to Display Metrics from Google Analytics and Sourceforge

Building a Marketing Dashboard to Display Metrics from Google Analytics and Sourceforge

The eXo marketing team wanted to be able to view website visit information with daily download statistics in a single view, without having to log into 2 separate sites and manually pull down reports. We solved this problem by building a gadget that can pull data from Google Analytics (visitor statistics) and from Source Forge (download statistics).

01-xSelection_017

Integrate your website with Google Analytics

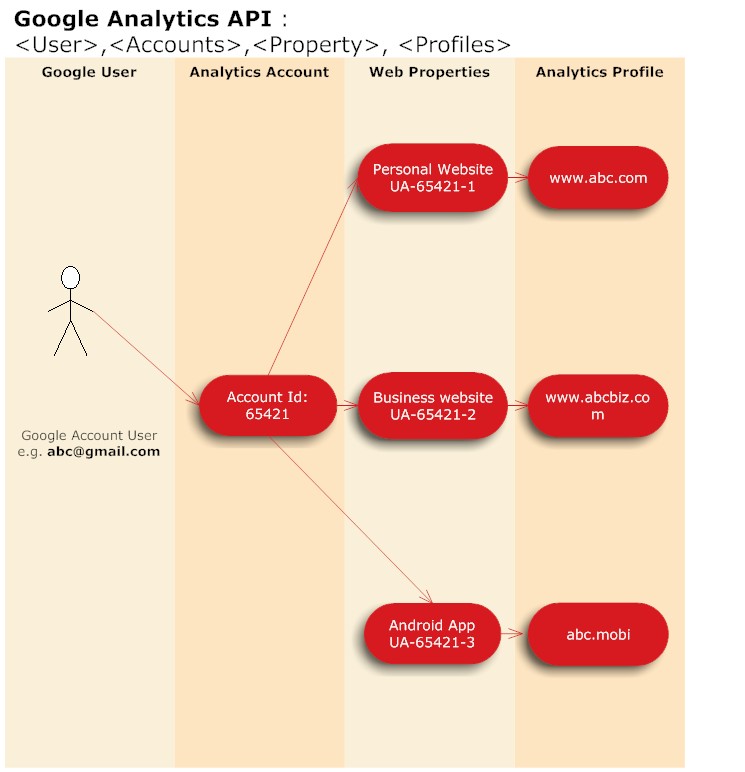
We use Google Analytics (GA) service to track our website visit and page view. At first, you would need a Google account which enables you to access to all Google products and services (e.g Gmail, Play, Google+ …) then you can sign up to use Google Analytics feature. One GA account could have several web properties and a web property can be referred to as one website which can be tracked independently. Each web property will have at least one analytics profile that has access to all the analytics data and reports. The details of the relationship is highlighted in the below diagram

02-xGoogle_User_Profile_Account1

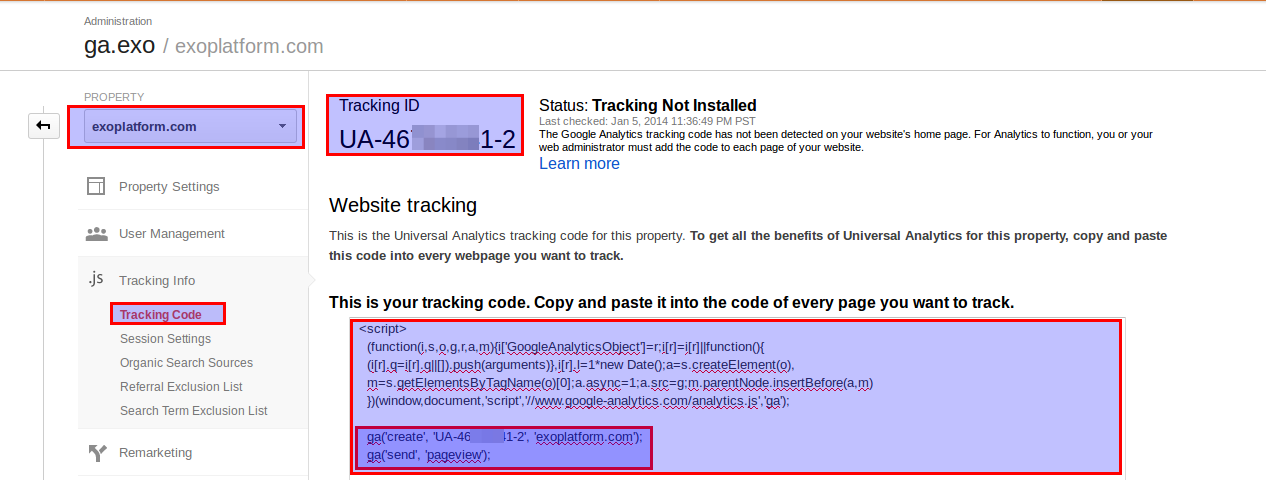
After register successfully for a GA account, you need to create your own web property and get the tracking code. Paste this tracking code into code of every single page that you want to track.

03-xSelection_018

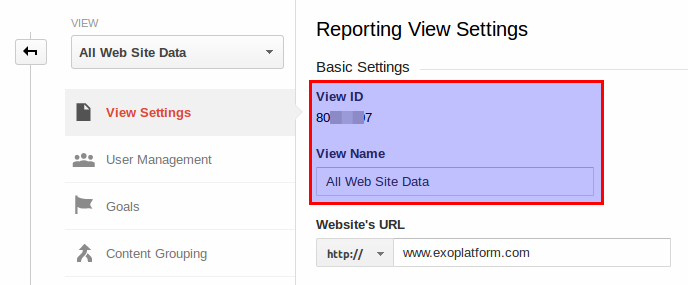
There is an automatically created profile named All Web Site Data. This profile ID is unique and you will take this profile ID to pull out your analytics data.

04-xSelection_019

Getting Data from Google Analytics

We will access Google Analytics data through Google API. To do so, please follow these steps:

1. Register a project in the APIs Console (you can use the same Google account which you used for Google Analytics).

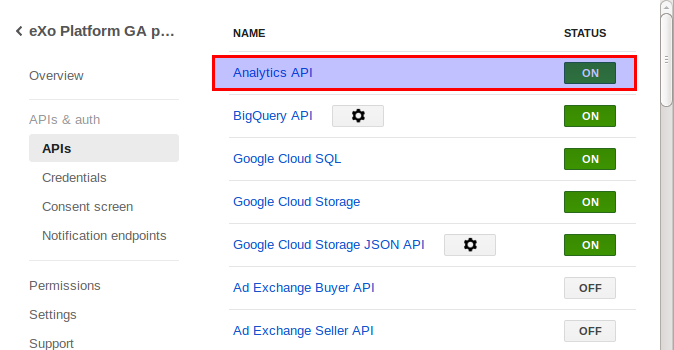
2. In the Google APIs Console, make sure you have Analytics API switch to ON.

05-xSelection_020

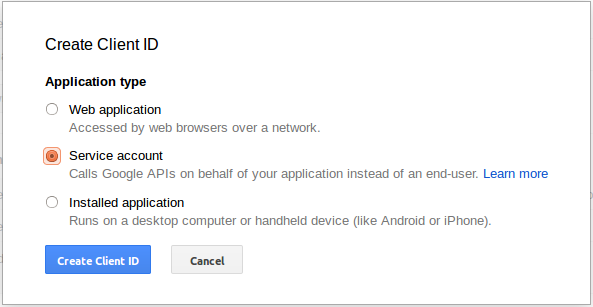
3. In Credentials pane, create a client ID with the Application Type set to Service Account.

06-xSelection_022

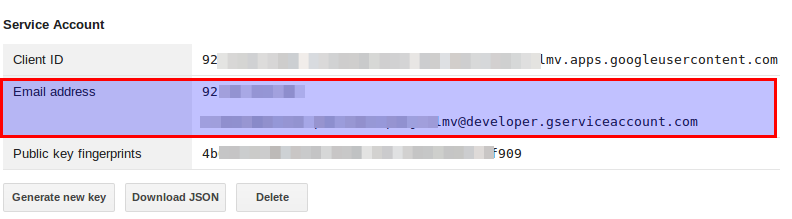
This would ask you to save a .p12 file which is a private key allows you to access your Google APIs without login. Save this file and name it as ga_privatekey.p12. You will take responsibility to safely keep and use this file.

4. Sign-in to Google Analytics and navigate to the Admin section.

5. Select the account for which you want the application to have access to.

6. Add the email address, from the Client ID created in the APIs Console from step #3, as a user of the selected Google Analytics account and grant at least read permission for this user.

07-xSelection_024

In this google-analytics-client-0.1.jarA we have provided a REST as a Google Analytics API client. This REST will use ga_privatekey.p12 file to get login to Google Analytics API. To deploy this REST, you just need to copy this google-analytics-client-0.1.jar file into the /lib folder of your Tomcat home folder and copy ga_privatekey.p12 file into Tomcat home folder then restart your Tomcat server. In our gadget, we make call to this REST. To use this gadget, you need to provide some preferences like the email address of client ID (GA ID) which generated in step #3 and the Analytics profile ID (Analytics View ID) you would like to access.

<userpref datatype="string" default_value="" name="Analytics_View_ID">
<userpref datatype="string" default_value="" name="GA_ID"></userpref></userpref>

The REST would help you to obtains the visit information of given analytics profile.

        function getVisitsData() {
                var analytics_view_id = prefs.getString("Analytics_View_ID");
                var GA_Account_ID = prefs.getString("GA_ID");
                var d  = new Date();
                var start_date = paramDate(new Date(d.getTime()-7*24*60*60*1000));
                var end_date = paramDate(d);
                var url = '/rest/ga/get-data/'+GA_Account_ID+'/'+analytics_view_id+'?start_date='+start_date+'&end_date='+end_date;
                return $.parseJSON(queryREST(url,null).responseText);
        }

Getting Data from Sourceforge

We use API provided by SourceForge to get the downloads statistics data. You need to provide your SF project name as a preference.

<userpref datatype="string" default_value="" name="SourceForge_proj_name"></userpref>

Then we can simply get and extract these data using YQL.

        function getDownloadsData() {
                var proj_name = prefs.getString("SourceForge_proj_name");
                var d  = new Date();
                var start_date = paramDate(new Date(d.getTime()-7*24*60*60*1000));
                var end_date = paramDate(d);
                var fakeTimestamp=d.getUTCHours() + d.getUTCMinutes();
                //provide url to your sourceforge.net project
                var url = "https://sourceforge.net/projects/"+ proj_name +"/files/stats/json?start_date="+start_date+"&end_date="+end_date+"&fake="+fakeTimestamp;
                var query = "select * from json where url=\"" + url + "\"";
                return $.parseJSON(queryREST("https://query.yahooapis.com/v1/public/yql",{ q: query, format: "json" }).responseText);
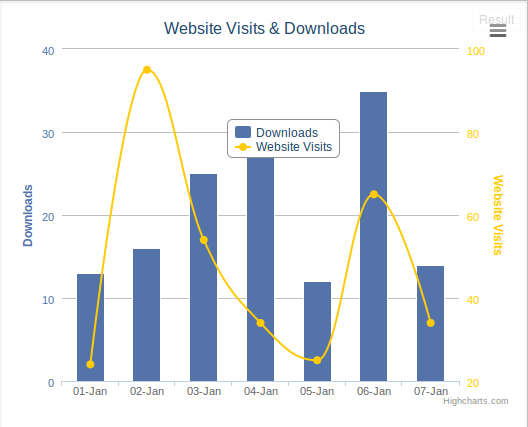
        }

Drawing the Dashboard Chart

We are going to use highcharts.js to draw our graph. It takes 3 data arrays: time frame data, visits stats data & downloads stats data. Now we are ready to create our beautiful chart which show the visits and downloads statistics of the last 7 days

        function drawChart(dataVisits, dataDownloads, dataCats){
        chart=new Highcharts.Chart({            
                        chart: {
                                                renderTo: 'container'
          },
          title: {
                text: 'Website Visits & Downloads'
          },            
          xAxis: [{
                categories: dataCats
          }],
          yAxis: [{ // Primary yAxis          
                labels: {
                        format: '{value}',
                        style: {
                                color: '#5373a9'
                                }
            },
            title: {
                text: 'Downloads',
                style: {
                        color: '#5373a9'
                                }
                },
            min : 0,
            allowDecimals: false
          }, { // Secondary yAxis
                labels: {
                        format: '{value}',
                        style: {
                                color: '#ffcb08'
                                }
                        },
                        opposite: true,
                        title: {
                                text: 'Website Visits',
                                style: {
                                color: '#ffcb08'                                
                                }
                        },
                        min : 0,
                        allowDecimals: false
                        }],
                        tooltip: {
                                shared: true
                                },
                                legend: {
                                        layout: 'vertical',
                                        align: 'center',
                                        x: 0,
                                        verticalAlign: 'top',
                                        y:20,
                                        floating: true,
                                        backgroundColor: '#FFFFFF'
                                        },
                                        series: [{
                                                name: 'Downloads',
                                                color: '#5373a9',
                                                type: 'column',
                                                data: dataDownloads
                                        }, {
                                                name: 'Website Visits',
                                                color: '#ffcb08',
                                                type: 'spline',
                                                yAxis: 1,
                                                data: dataVisits
                                        }]
                                });
                        }

Going Further

Extending the marketing dashboard will make it easier to identify patterns and determine the impact of various marketing activities on driving key metrics. You could also pull articles from your blog, in order to include other company events in the graph.

Useful Resources

  • MarketingMetricsGadget.xml
  • google-analytics-client-0.1.jar
  • Source code for google-analytics-client-0.1.jar

Questions? Remarks? Join the discussion on the eXo Community!


make-the-most-out-of-eXo-platform4

Make the most out of eXo Platform 4

Register to the next webinar and get a complete overview of what you can do with eXo Platform 4. Reserve your seat now!

Brahim Jaouane

I am a Digital Marketing specialist specialized in SEO at eXo Platform. Passionate about new technologies and Digital Marketing. With 10 years' experience, I support companies in their digital communication strategies and implement the tools necessary for their success. My approach combines the use of different traffic acquisition levers and an optimization of the user experience to convert visitors into customers. After various digital experiences in communication agencies as well as in B2B company, I have a wide range of skills and I am able to manage the digital marketing strategy of small and medium-sized companies.

Full-featured digital workplace with everything your employees need to work efficiently, smartly integrated for a compelling employee experience

  • Product
    • Software tour
    • Communication
    • Collaboration
    • Knowledge
    • Productivity
    • Open Source
    • Integrations
    • Security
  • Uses cases
    • Digital Workplace
    • Intranet software
    • Collaboration software
    • Knowledge management software
    • Entreprise Social Network
    • Employee Engagement platform
  • Roles
    • Internal Communications
    • Human Resources
    • Information Technology
  • Company
    • Product offer
    • Services Offer
    • Customers
    • Partners
    • About us
  • Resources
    • FAQs
    • Resource Center
    • Collaboration guide
    • What is a Digital workplace?
    • What is an intranet?
    • Employee engagement
  • Terms and Conditions
  • Legal
  • Privacy Policy
  • Accessibility
  • Contact us
  • Sitemap
  • Facebook
  • Twitter
  • LinkedIn
wpDiscuz